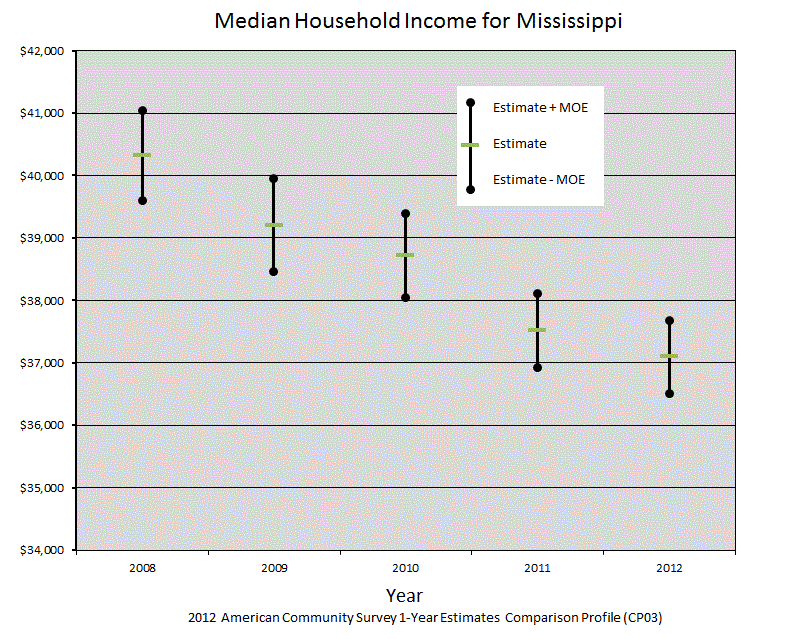
This graph shows the change in Median Household Income from 2008 to 2012. All figures have been adjusted to 2012 dollars.
Median Household income Graph. Overlapping margins of error indicated the change may not be statistically significant.
Comparing Regions for the Same Year
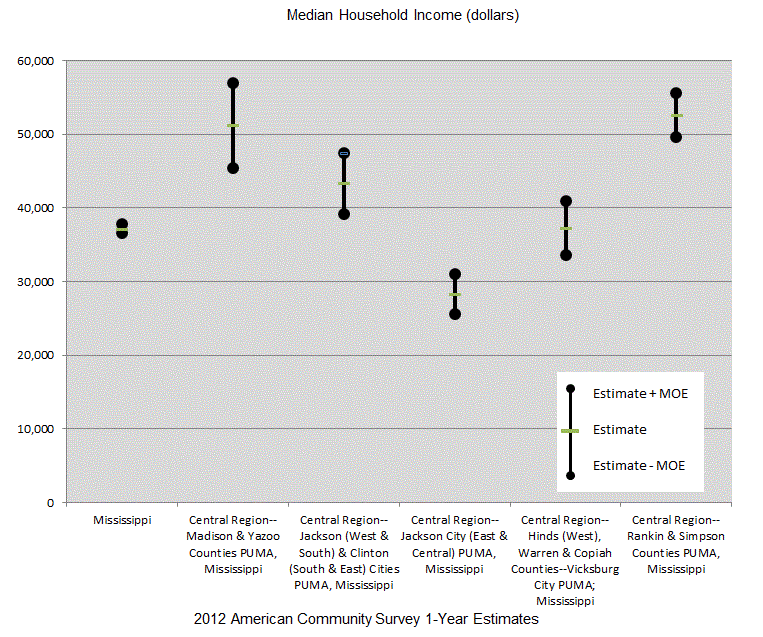
Median Household Income for Central Region

